TIM Detect
This part of the documentation dives into TIM's capabilities for anomaly detection: TIM Detect. The following sections can be explored to build up a comprehensive understanding of these capabilities:
- How it works: how the solution is designed to go from raw data to accurate anomaly detection.
- KPI-driven: how TIM Detect's KPI-driven approach works and how to use it.
- System-driven: how TIM Detect's system-driven approach works and how to use it.
- Outlier detection: how TIM Detect's outlier approach works and how to use it.
- Drift detection: how TIM Detect's drift approach works and how to use it.
- Concepts: how to prepare the experiment to achieve the best results for your problem.
- Glossary: the terminology of uncommon or specialized terms used in TIM Detect.
Overview
TIM Detect covers two main areas: anomaly detection and drift detection.
While anomaly detetion focuces on identifing individual observations which do not conform to an expected behavior, the drift detection focuces on detectecting changes in distribution of whole entity.
TIM supports following approaches for them:
Anomaly detection
Anomaly detection solves time-series detection problems, supporting multidimensional data. Three approaches are available: the KPI-driven approach, system-driven approach and outlier approach.
Based on the data, problem, goal and preference, one or a combination is suitable. The KPI driven approach strives to detect whether a chosen variable (the KPI) behaves normally with respect to other variables (influencers), while the system-driven approach strives to detect whether the system (represented by all variables) is in a normal state and outlier approach search outliers within distribution of each individual variable. This means that what does and what does not constitute an anomaly can differ between the approaches, as follows:
- for the KPI-driven approach,
- an anomaly means the influencers are impacting the KPI less or more than expected, i.e. the actual state of the kPI would typically be higher or lower given the circumstances (influencers), while
- no anomaly means the influencers are impacting the KPI as usual, i.e. the actual value of the KPI is appropriate given the cirumstances (influencers);
- for the system-driven approach,
- an anomaly means the current combination of all variables is unusual, i.e. the system is in an unknown state, whereas
- no anomaly means the current combination of all variables is expected, i.e. the system has often been found in a similar state before;
- for the outlier approach,
- an outlier means the value of a variable occurs with low probability
- no outliers means values of a variable occurs very often; and
The following simple visual demonstration of a two-dimensional situation can in deciding which approach is right for a use case. It illustrates how the problem is understood by each approach (in the ideal scenario).
- The KPI-driven approach:


- The outlier approach

To see the (differences in) results of all three approaches, have a look at a simple two-dimensional dataset where variable 1 equals about half of variable 2.
- The KPI-driven approach:
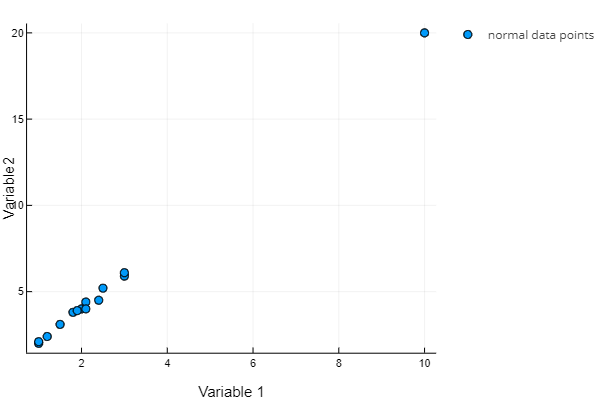
All data points are considered normal as Variable 1 is affected by Variable 2 as usual; all Variable 1 values are appropriate given the Variable 2 values.
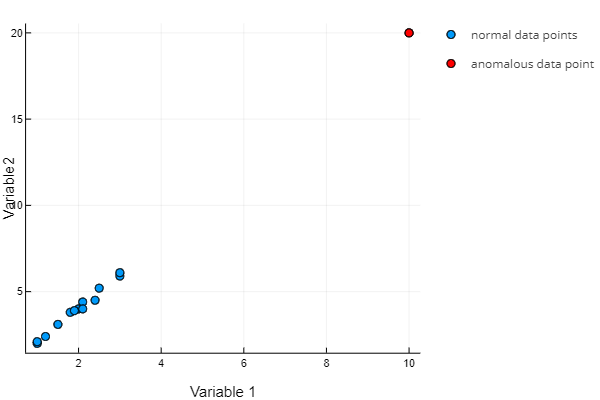
The point [10, 20] has an unusual combination of Variable 1 and Variable 2; the same or a similar combination of these variables was never seen before.
Which approach is more suited depends on the problem at hand, and should thus be decided case by case.
Drift detection
In drift detection, there is only one approach and that is drift approach. This approach checks if there is a change in the distribution of each variable. It is a univariate approach - each variable is checked independently.
For the drift approach:
- a drift means the distribuition of a variable changed against reference distribution
- no drift means the distribution of a variable is same as the reference distribution.